Expanding barriers early
Our case concerns the internal representation of garbage collection (GC) barriers in C2. These are additional instructions inserted around the memory accesses of an application to inform the garbage collector about details of the access, such as what value is held in the accessed memory position before and after a memory write. There are multiple ways in which a compiler can handle GC barriers. One way (“the right way” if you ask a compiler engineer) is to treat barrier operations explicitly and uniformly, as if they were any other program operation, in the compiler’s intermediate representation (IR). The argument for doing this is that it allows the compiler to apply its regular analysis and transformation mechanisms to turn the GC barriers into highly-optimized assembly code. We call this approach “early barrier expansion” because it translates barriers into IR operations at the beginning of the compilation chain.
The cost of early barrier expansion for G1
Early barrier expansion is the current choice in C2 to deal with the barriers
required by the JVM’s default collector (called
G1). Some collectors require
barriers for both memory reads and writes. G1 requires barriers for writes
only… but not just any barriers! A G1 write barrier is represented by more
than 100 IR operations, and results in around 50 x64 instructions. Since memory
writes are fairly common operations, this just bloats up the IR. Remember C2’s
IR of a factorial
method? Well, here
is an apparently simpler method that just stores an object bar into the field
f of another object foo, requiring a G1 write barrier:
void write(Foo foo, Bar bar) {
 foo.f = bar;
}
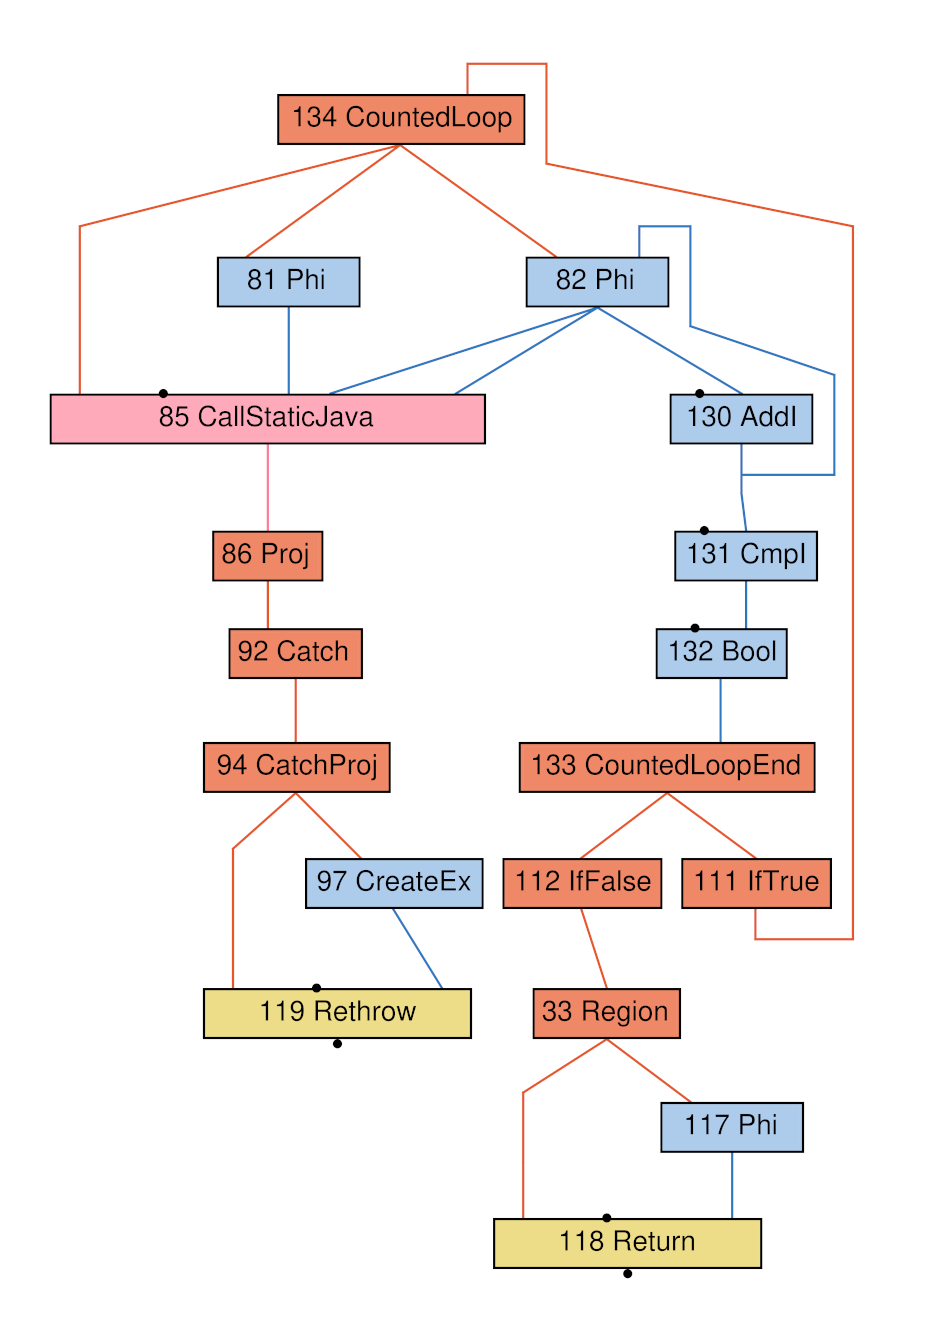
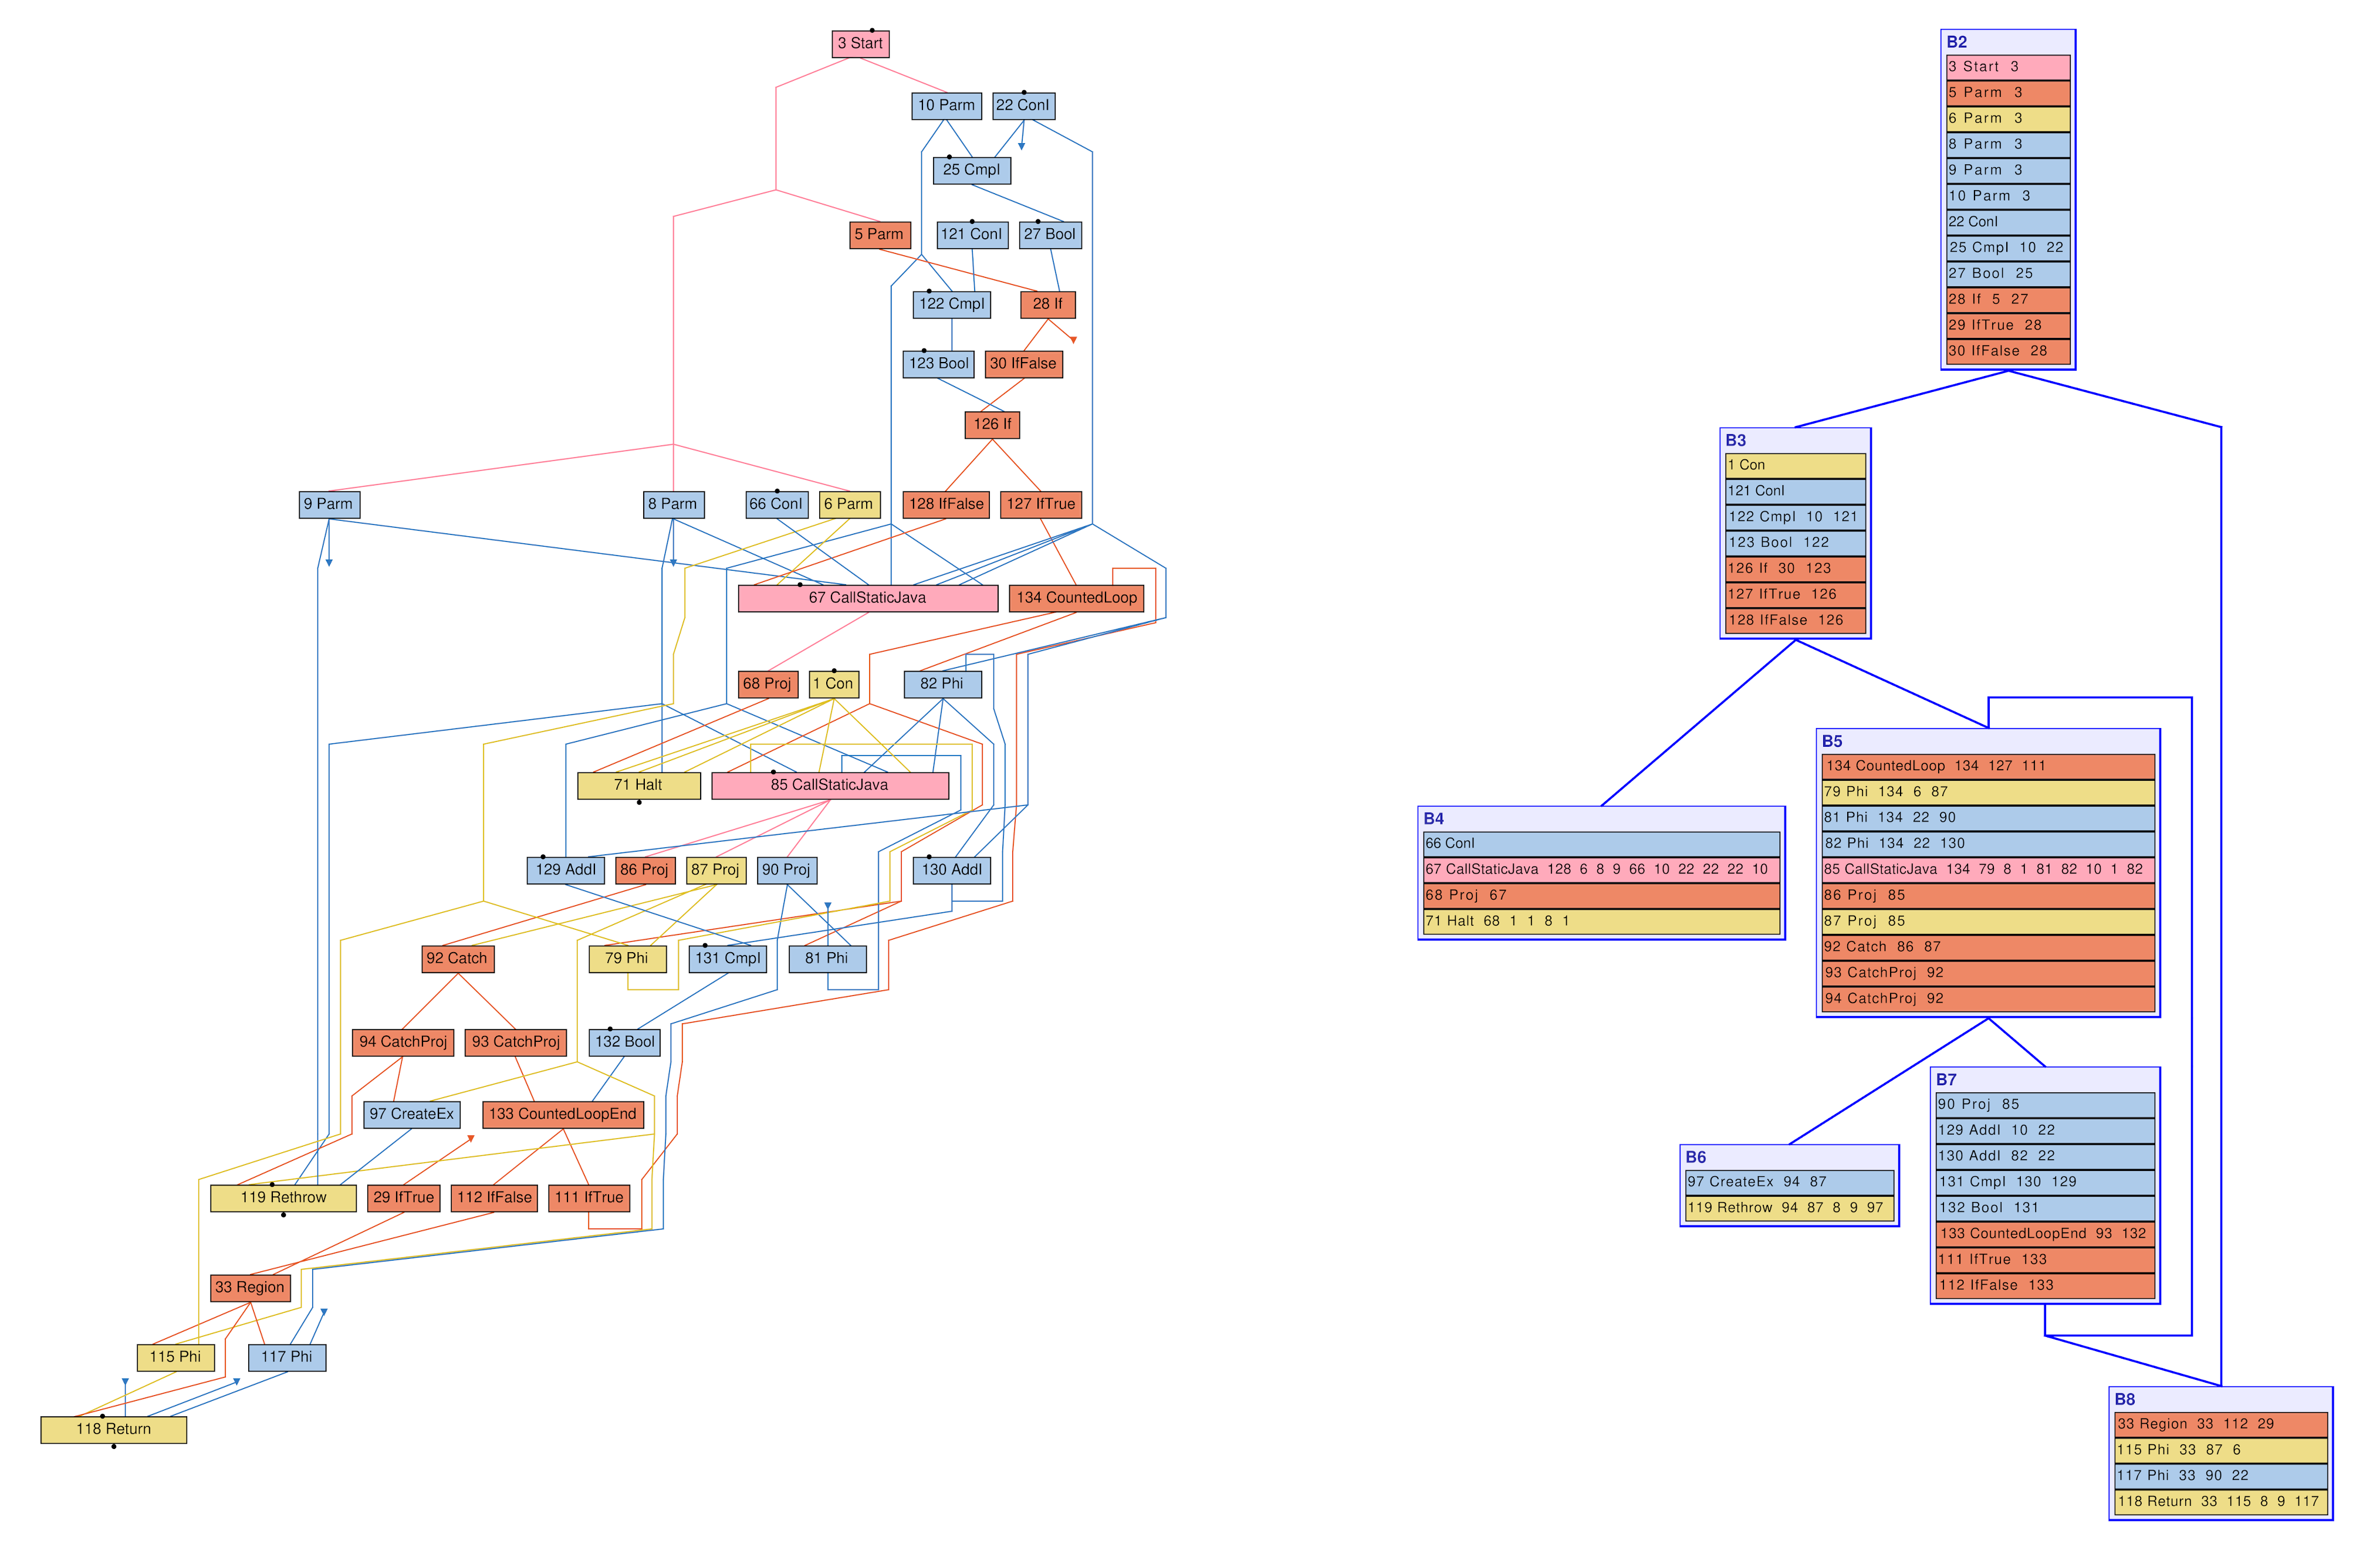
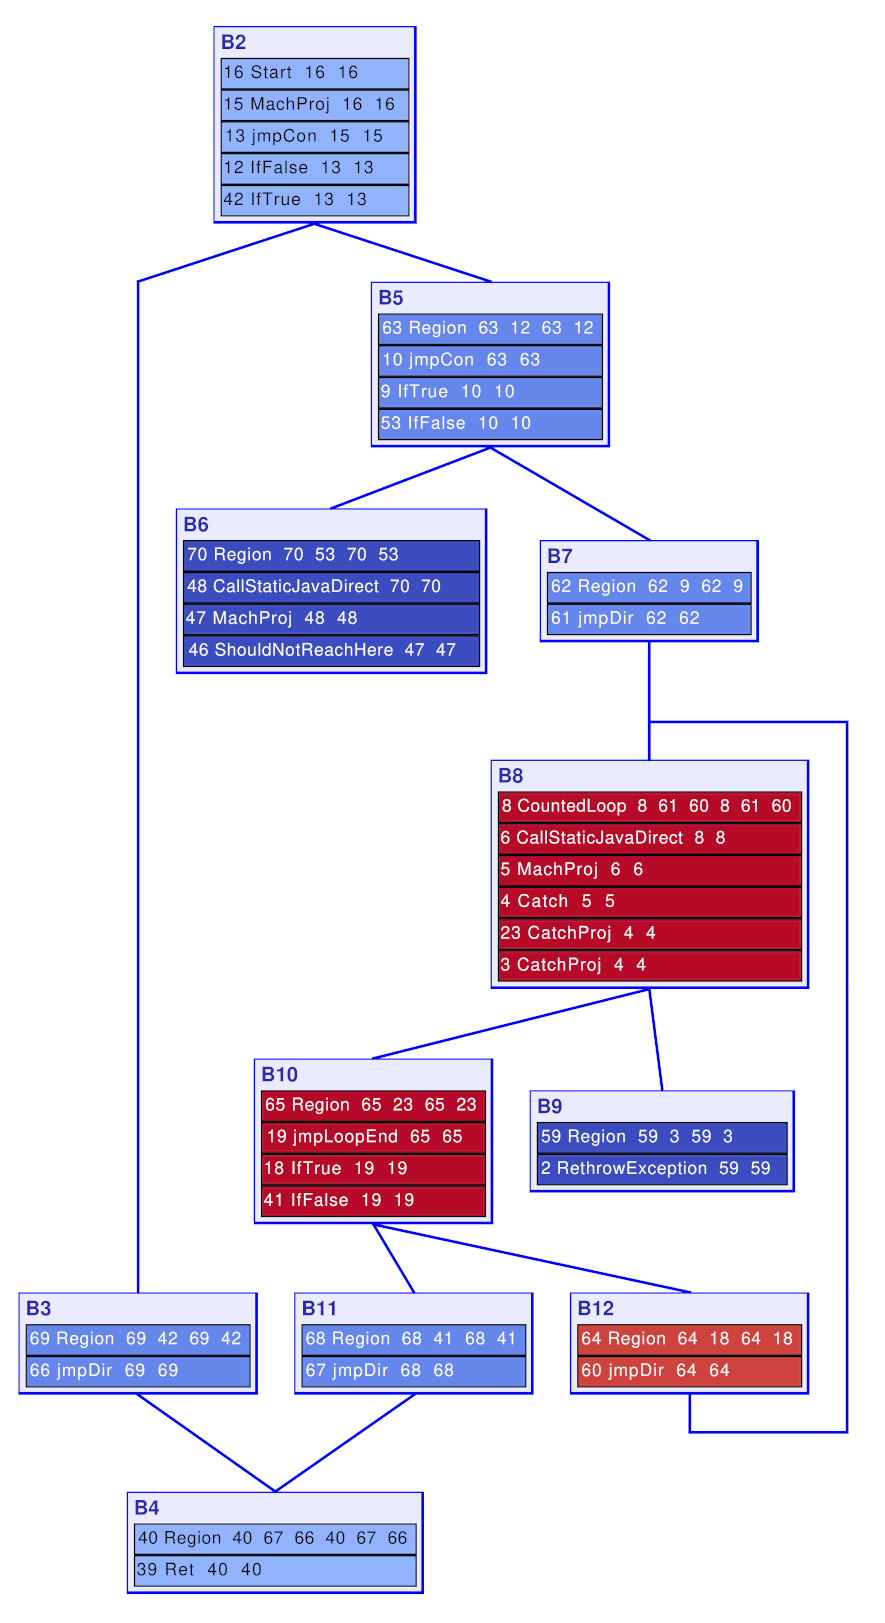
and here is the corresponding IR, in control-flow graph form:
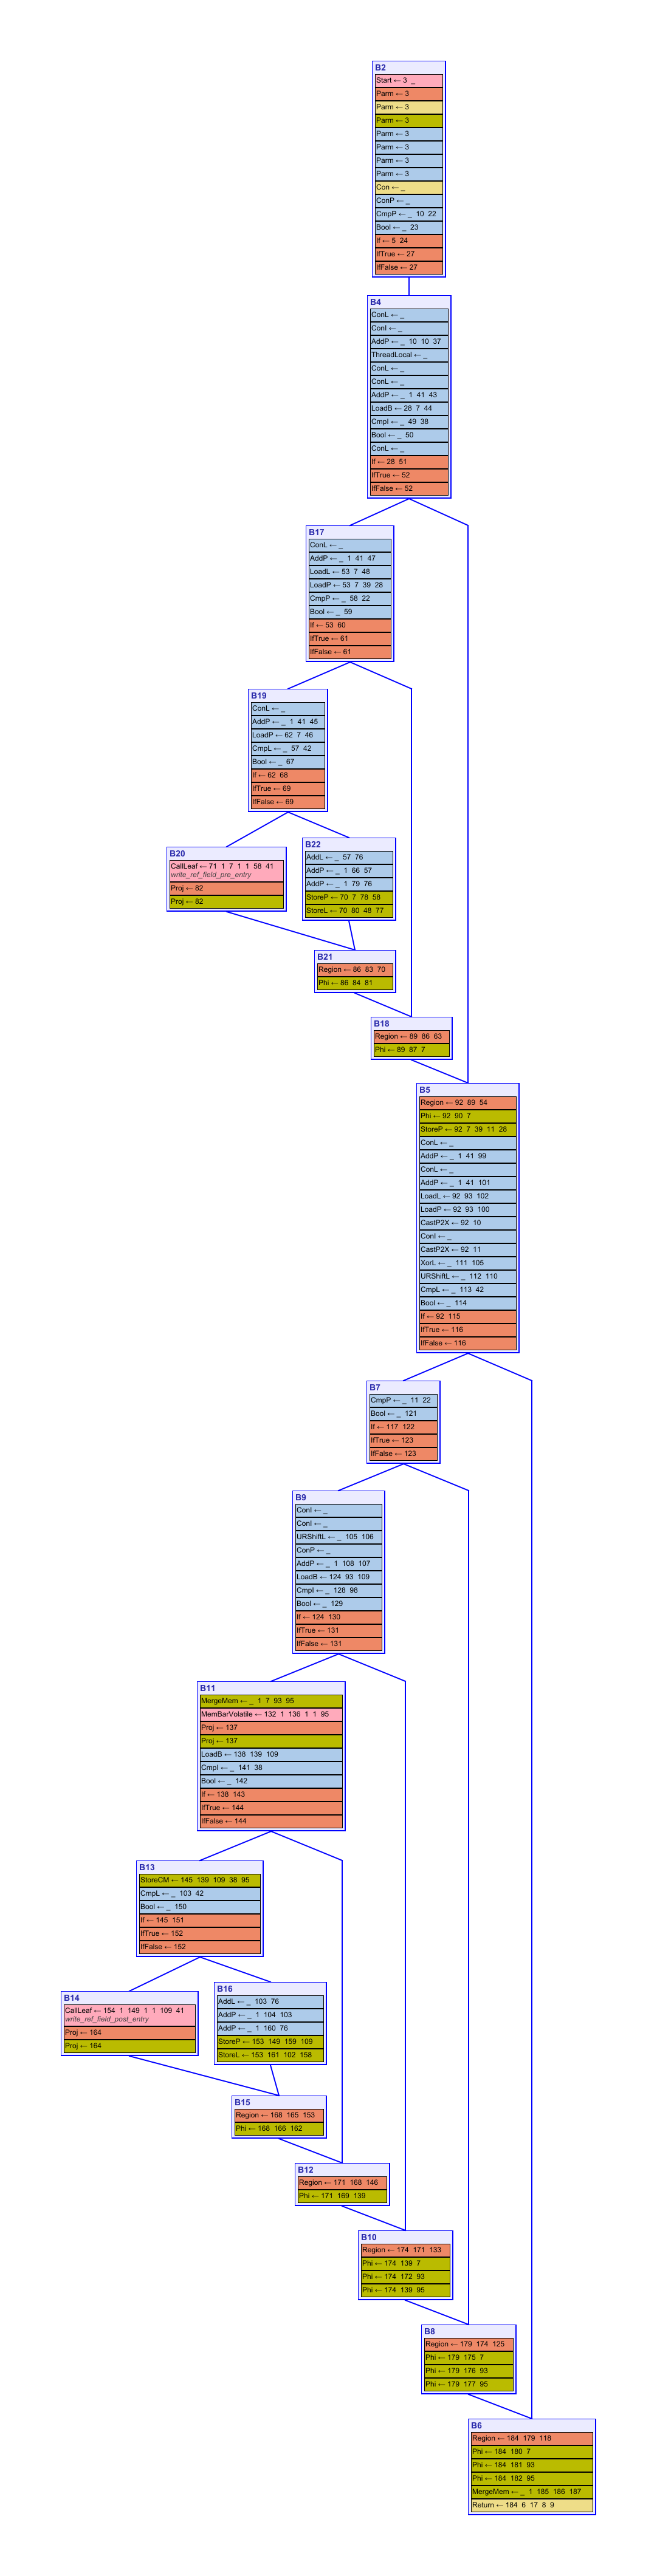
Control-flow graph of a G1 write barrier in C2
A larger IR imposes inevitably a higher compilation overhead: in preliminary experiments running the DaCapo 9.12-bach benchmark suite on different platforms (Linux/x64, macOS/aarch64), G1 barrier IR operations account for around 20% of C2’s total execution time.
The opposite approach: late barrier expansion
What can be done? A radically different way of dealing with GC barriers in a compiler is to simply hide them from the compiler through the entire compilation time, and just “paste” the corresponding instructions around their memory access instructions at code emission time. This apparently naive approach (which we call “late barrier expansion”) has an undeniable advantage: simplicity. Because it is so simple, it can be implemented very cheaply, which gives a noticeable C2 speedup in our preliminary experiments. And, perhaps more importantly, it frees GC maintainers from a task they never signed up for: dealing with the intricacies and quirks of a 25-year old compiler in order to tune and optimize their precious barriers.
Wait, what about performance?
At this point, the compiler engineer in the room has no option but to point out that late barrier expansion surely produces code of worse quality, since it is not analyzed and optimized together with the rest of the application, just “pasted” into the final assembly code. While this is true on paper, we have not observed any significant performance degradation by moving from early to late G1 barrier expansion in C2. It seems there isn’t just that much room for optimization within G1’s barriers, and the potential negative effects of remaining inefficiencies, if any, are covered up by the mercifulness of modern processors.
But, what if our compiler targets fifteen different platforms?
Our compiler engineer might patiently argue that the late barrier expansion model is less maintainable, because it requires a handwritten implementation for each platform targeted by the compiler. This is definitely a problem in the general case, but luckily for us, the JDK already includes platform-dependent G1 barrier implementations for bytecode interpretation, and with a bit of plumbing we can reuse them for C2.
Hopefully, at this point everyone in the room agrees that late barrier expansion is a sensible choice for G1. Sometimes one has to swallow the urge to optimize every detail of the program under compilation and put into the balance the many other dimensions involved in compiler design: compilation time, modularity, maintainability, etc. This is one of the lessons I (like to think) have learnt in my transition from academia to industry.
By the way, have a look at our JDK Enhancement Proposal description if you are interested in the gory details of the story.
Acknowledgements: thanks to Daniel Lundén for proofreading an earlier version of this post.
]]>